There is a simpler way to debug an STM32 with printf using your ST-Link within STM32CubeIDE—no need to add another UART port. See below to find out.
Introduction
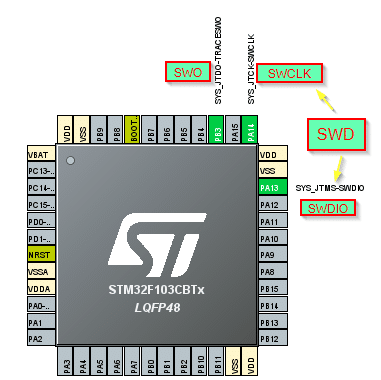
If you have an ST-Link (an original or a clone) you’ll have an easier time debugging your STM32 devices with printf using STM32CubeIDE. The reason is ST incorporates a flexible debugging and tracing structure in its software and most of its STM32 MCUs. All you need are the basic Serial Wire Debug (SWD) pins (as discussed in this ST-Link tutorial) and an additional Serial Wire Output (SWO) pin.
What is SWV (Serial Wire VIEWER)?
When you are using both the SWD and SWO pins, you are ready to enter Serial Wire Viewer tracing (SWV) debug mode. SWV provides real-time tracing and advanced system analysis that its SWD-only debug mode counterpart cannot do. Additionally, you get real-time data with SWV without needing to halt during a debugging session, unlike in SWD.
Another module in software called ITM (Instrumentation Trace Macrocell) allows apps to write data on the SWO pin line through ports. With this, you can redirect printf() functions to write to a console in SWV mode using this ITM feature.
What Kind of ST-Link HArdware is Needed
Nucleo HArdware
Nucleo hardware is ready to set up SWV since it usually has ST-Link installed in it. You may need to bridge some pads on the board to activate this feature.
ST-Link Clone
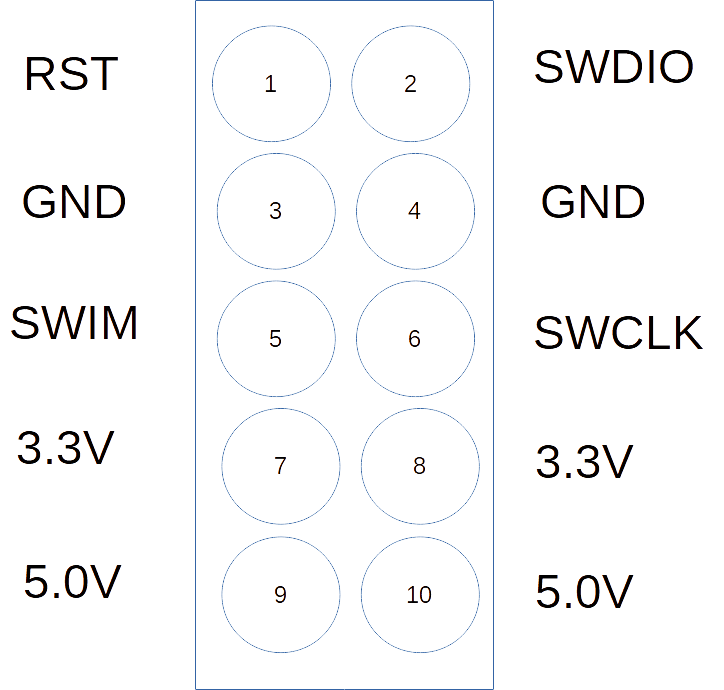
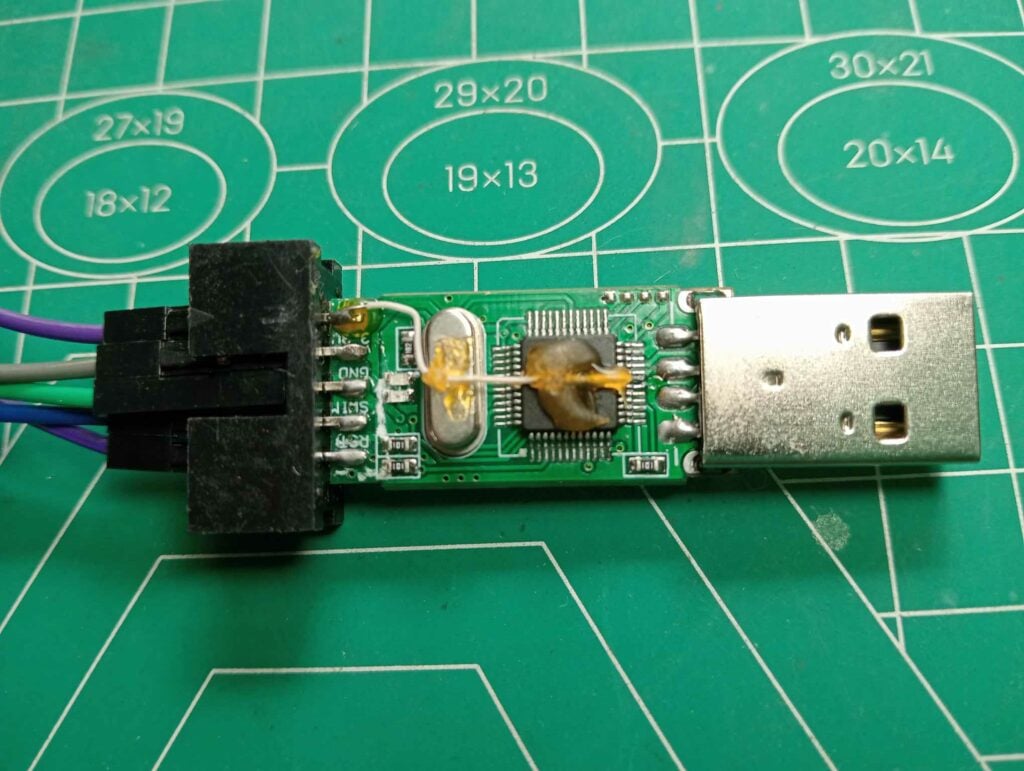
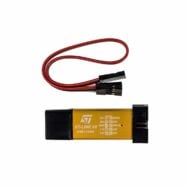
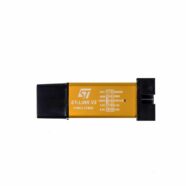
ST-LinkV2 clones (unlike original NUCLEO boards), unfortunately, are not ready to go into SWV debug trace mode. These clones only output the pins below and have no SWO pin.
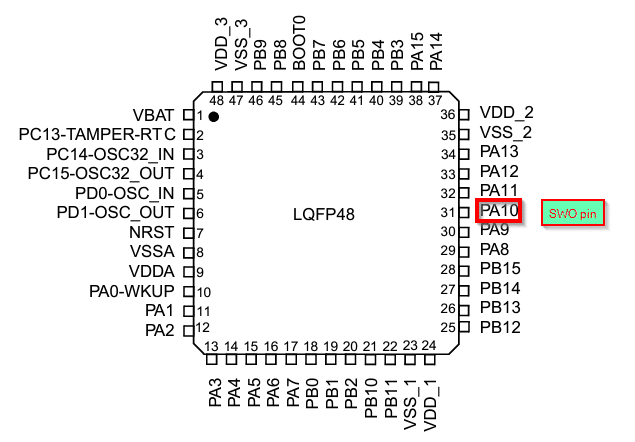
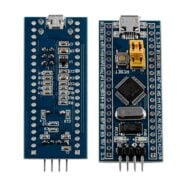
To get around this, you’ll have to look for the pin that functions as SWO (inside the device) and get it outside. Usually, these ST-Link clones are just STM32F103s. The SWO function is in PA10 as seen below.
With this, take apart your ST-Link clone and prepare a jumper wire. Connect the pin PA10 to a terminal on the ST-Link that you don’t use (such as the 5V line in this case). Make sure to remove the connection of this pin to its former function (beware of via pads).
Ready a Sample Code
Cut and paste this code into your main.c file. In case you’re wondering, this code came from the syscalls.c file. Replace the __io_putchar function with the CMSIS ITM_SendChar() function. The ITM_SendChar() function will send the printf() characters to port 0 of the ITM.
					/* USER CODE BEGIN 4 */
int _write(int file, char *ptr, int len)
{
  (void)file;
  int DataIdx;

  for (DataIdx = 0; DataIdx < len; DataIdx++)
  {
    //__io_putchar(*ptr++);
	  ITM_SendChar(*ptr++);
  }
  return len;
}
/* USER CODE END 4 */
Also include the stdio.h file as this is needed for the pintf() function to work and not generate unnecessary debug warnings.
					/* Private includes ----------------------------------------------------------*/
/* USER CODE BEGIN Includes */
#include <stdio.h>
/* USER CODE END Includes */
You can now enter printf() functions in your main.
					  /* Infinite loop */
  /* USER CODE BEGIN WHILE */
  while (1)
  {
	  HAL_GPIO_TogglePin(LED_GPIO_Port, LED_Pin);
	  HAL_Delay(500);
	  printf("Hello World!\n");
    /* USER CODE END WHILE */

    /* USER CODE BEGIN 3 */
  }
  /* USER CODE END 3 */
Debug with Serial Wire Viewer
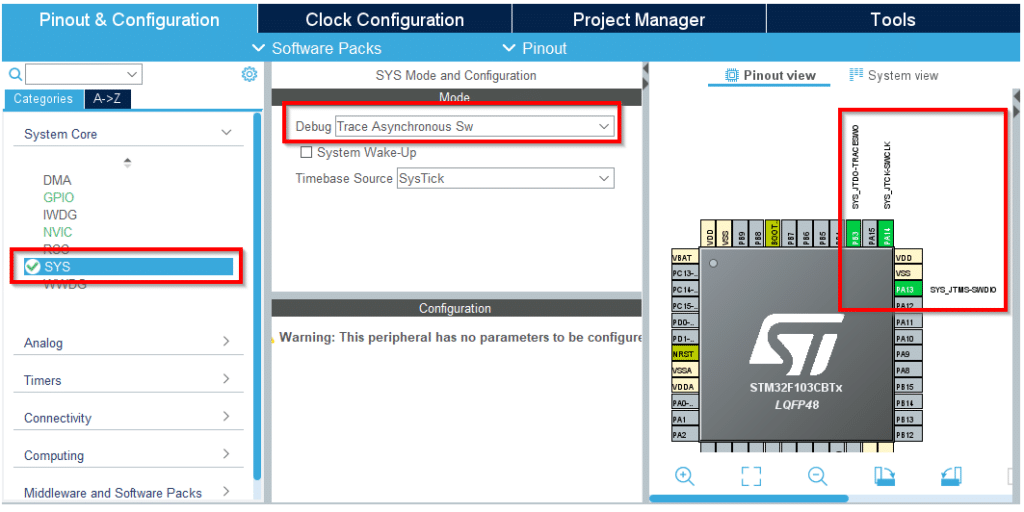
Before you can debug using SWV, you should enable Trace Asynch Sw in Debug on SYS on the System Core. This will set all the pins needed for SWV.
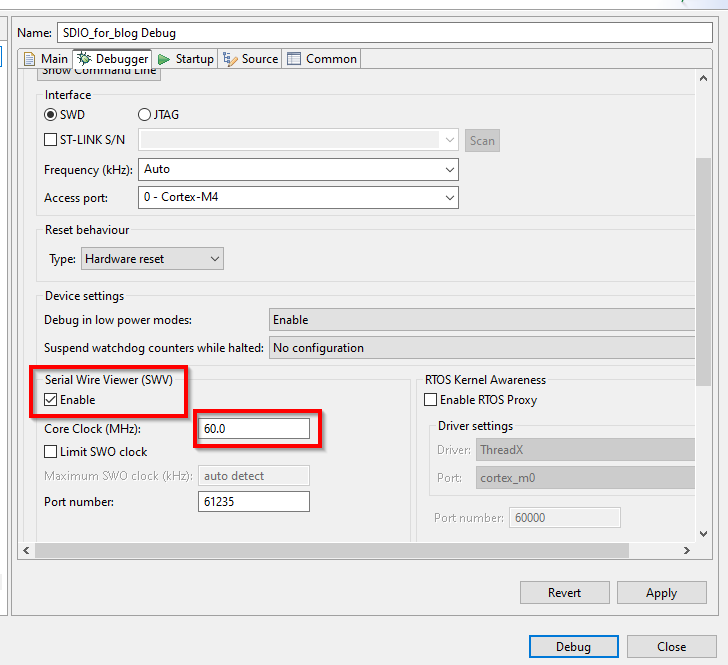
Next, on Run -> Debug Configurations, go to the Debugger tab. Enable Serial Wire Viewer (SWV) and then match your system clock frequency to the Core Clock used by SWV.
Click Apply and then do a Debug.
SWV ITM Data Console
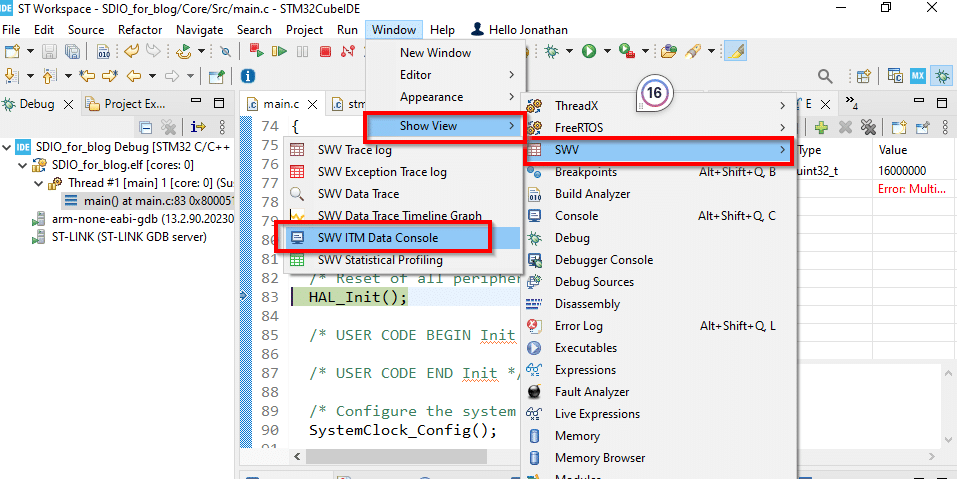
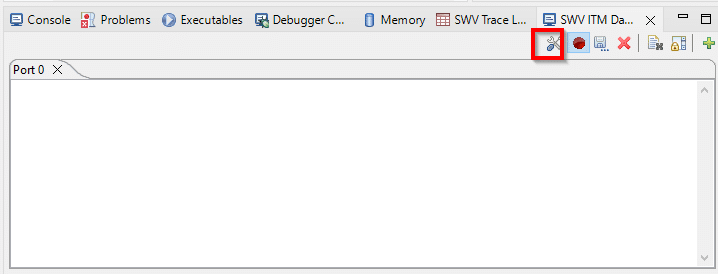
To be able to show your printf()s on a console, you must access the SWV ITM Data Console Window. While still in Debug (on a pause), go to Window -> Show View -> SWV ITM Data Console
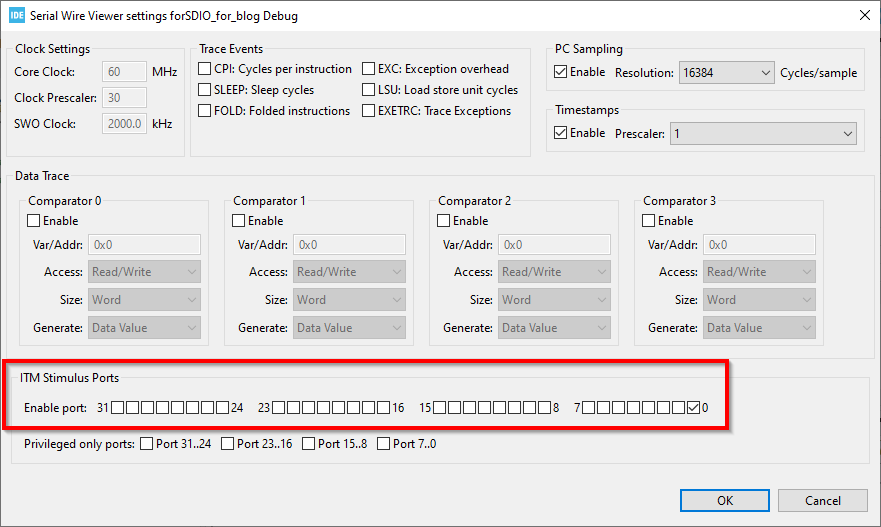
Configure the SWV ITM Console Window through the configuration button below.
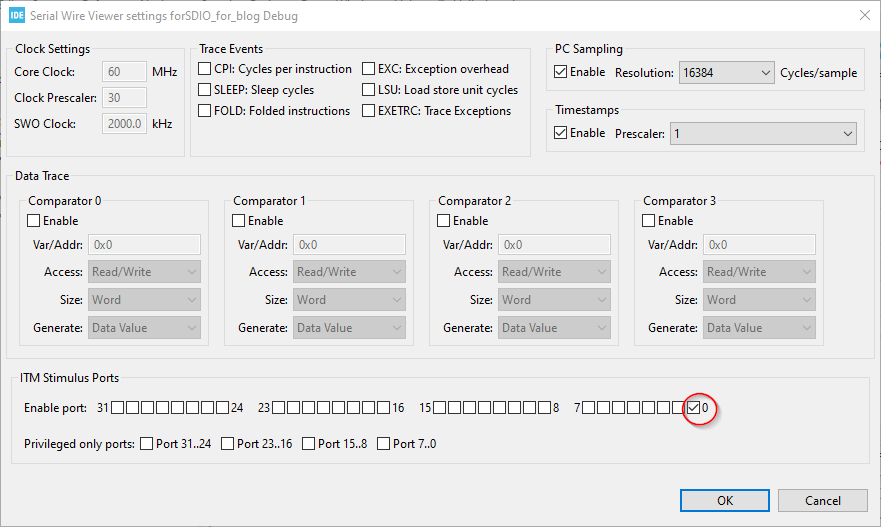
Next, tick port 0 of the ITM Stimulus Ports. Typically, this port is used to redirect the characters generated by the printf() function. Press OK to continue.
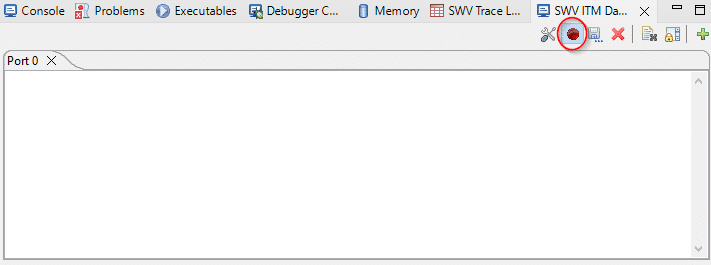
To run SWV, you must remember to click the Start Trace button.
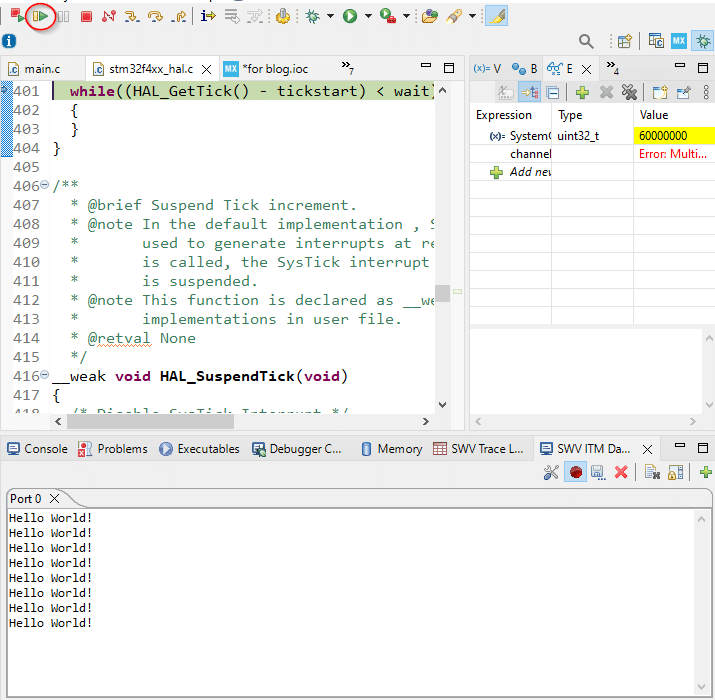
Thereafter, you can continue with your debug session by pressing Resume. You should see now your printf() debug data.
That’s it, hope you’ve learned a lot of stuff on this STM32 printf on ST-Link guide 🙂